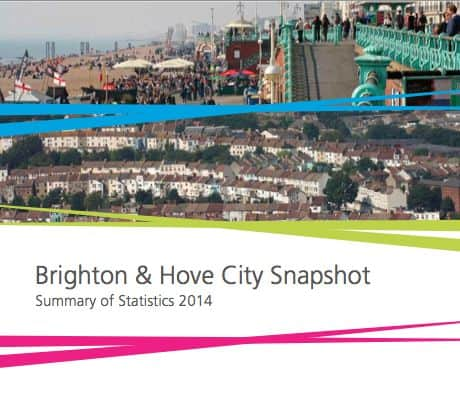
A snapshot of our city: New data reveals the truth about Brighton and Hove


A growing population, squeezed into every spare hectare; a diverse population, with one in five citizens from a black or minority ethnic background.
Relatively small households, with fewer children and fewer older people than elsewhere. A lot of students and a lot of people aged 20 to 44.
Advertisement
Hide AdAdvertisement
Hide AdSubstantial prosperity and high levels of satisfaction with everyday life.


But pockets of significant deprivation, with nearly one in five children living in poverty.
Welcome to Brighton and Hove in 2014.
A remarkable report, compiled by the corporate policy and research team at Brighton and Hove City Council, provides a fascinating insight into the opportunities and challenges facing our city.
The 28-page summary - entitled Brighton and Hove City Snapshot - pulls together the most-up-to- date statistics about who lives here, what their lives are like, and the challenges they face.
Advertisement
Hide AdAdvertisement
Hide Ad

With the help of graphs, charts and images, it reflects the vibrancy and diversity of a 21st-century city - albeit one that is inevitably fragmented and disparate in its composition.
A stunning two-page "infographic" in today's Brighton and Hove Independent aims at summarising many of the findings.
Key statistics relate to population, neighbourhoods, ethnicity, sexuality, older people, children and young people, families, health and wellbeing, housing, transport and infrastructure, community safety, environment, culture and leisure, business and enterprise, employment and skills, and investment and development.
A selection of findings includes:
Our city had the highest number of people in same-sex civil partnerships.This is five times higher than the proportion found in both the southeast and England as a whole;
Advertisement
Hide AdAdvertisement
Hide AdFor one in 12 residents aged over three (21,833, or 8.3%), English is not their main or preferred language; Arabic is the most widely spoken language in the city after English, with 0.8% of residents (2,226 people) using it as their main or preferred language;
Brighton and Hove has a lower proportion of older people - aged 65 years or over - than either the regional or national average. It is only at 90 years or above that we align with these averages. The number of older people has declined over the last 12 or so years from 40,450 people in the 2001 census to 35,692 people at the 2011 census, a decrease of 12%; of the 121,540 households, 12% (14,468 households) are occupied by people aged 65 years or more who live alone;
At the time of the most recent Child Poverty Index (2011), 19.6% of our city's dependant children were living in poverty; while this is in line with the national average of 20.1%, it is significantly in excess of the regional average of 14.6%;
A relatively-high proportion of our pupils have special educational needs. Last year, 20% of pupils (7,213) had special needs without statements, compared with 16% in England and 16.3% in the southeast.
Statistics are taken from Brighton and Hove City Snapshot Summary of Statistics 2014, published by Brighton and Hove City Council. For the full report, visit: www.bhconnected.org.uk/content/reports